Unlock Your
Business Data
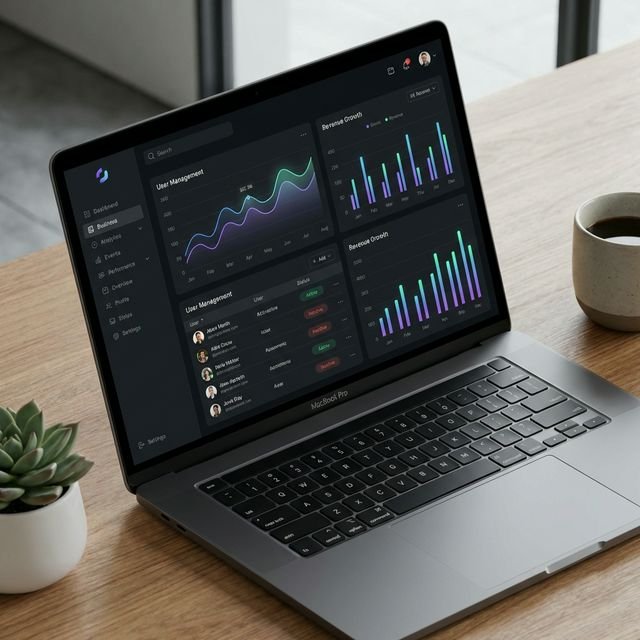
Unlock your business data and transform it into actionable insights with beautiful, interactive dashboards and automated reporting systems.
Starting from
KES 60,000
Every dashboard project is scoped and quoted individually. We send a written quote before starting.
Powerful Dashboard Features
KPI Tracking
Monitor key performance indicators in real-time with customizable widgets and threshold alerts.
Sales Analytics
Track revenue, sales trends, customer acquisition metrics, and conversion funnels.
Financial Dashboards
P&L statements, cash flow analysis, expense tracking, and budget vs. actual comparisons.
Operational Metrics
Process efficiency, resource utilization, productivity metrics, and performance analytics.
Automated Reports
Scheduled email reports, PDF exports, Excel downloads, and automated distribution.
Real-Time Updates
Live data updates, drill-down capabilities, custom filters, and interactive charts.
Dashboard Solutions for Every Need
Custom dashboards tailored to your specific business requirements and industry.
Executive Dashboard
High-level overview for C-suite executives showing company-wide KPIs, financial health, strategic goals progress, and market performance at a glance.
- Revenue & profit trends
- Strategic KPIs & goals
- Market share & growth metrics
Sales Dashboard
Comprehensive sales analytics showing pipeline health, team performance, conversion rates, and revenue forecasts to drive sales excellence.
- Sales pipeline visualization
- Team & individual performance
- Revenue forecasting & targets
Financial Dashboard
Real-time financial health monitoring with P&L statements, cash flow tracking, expense analysis, and financial ratios for informed decision-making.
- Cash flow & burn rate
- Budget vs. actual analysis
- Profitability by product/service
Operations Dashboard
Monitor operational efficiency with production metrics, inventory levels, supply chain performance, and resource utilization tracking.
- Production & inventory metrics
- Supply chain visibility
- Resource utilization rates
Why Choose Our Dashboards?
Transform your business intelligence with dashboards that turn complex data into clear, actionable insights.
Real-Time Data Sync
Live data connections to your systems ensure you're always looking at current information.
Custom Built for You
Every dashboard is tailored to your specific metrics, KPIs, and business processes.
Mobile Responsive
Access your dashboards anywhere, on any device - desktop, tablet, or smartphone.
Role-Based Access
Control who sees what with granular permissions and user roles.
Technical Features
- Direct database connections (MySQL, PostgreSQL, MongoDB)
- API integrations with popular platforms (Salesforce, QuickBooks, etc.)
- Interactive charts & graphs (bar, line, pie, scatter, heatmaps)
- Drill-down capabilities for detailed analysis
- Custom date ranges & filters
- Automated alerts & notifications
- Export to PDF, Excel, or CSV
- White-label branding options
- Scheduled report generation
- Multi-tenant support for agencies
How We Work
Frequently Asked Questions
Ready to get started?
Tell us what you need and we will put together a clear scope and a fair quote.